Comptage de plants pour les champs de production
Cette analyse détecte et compte automatiquement les plantes et les lacunes.
1. Entrées et paramètres
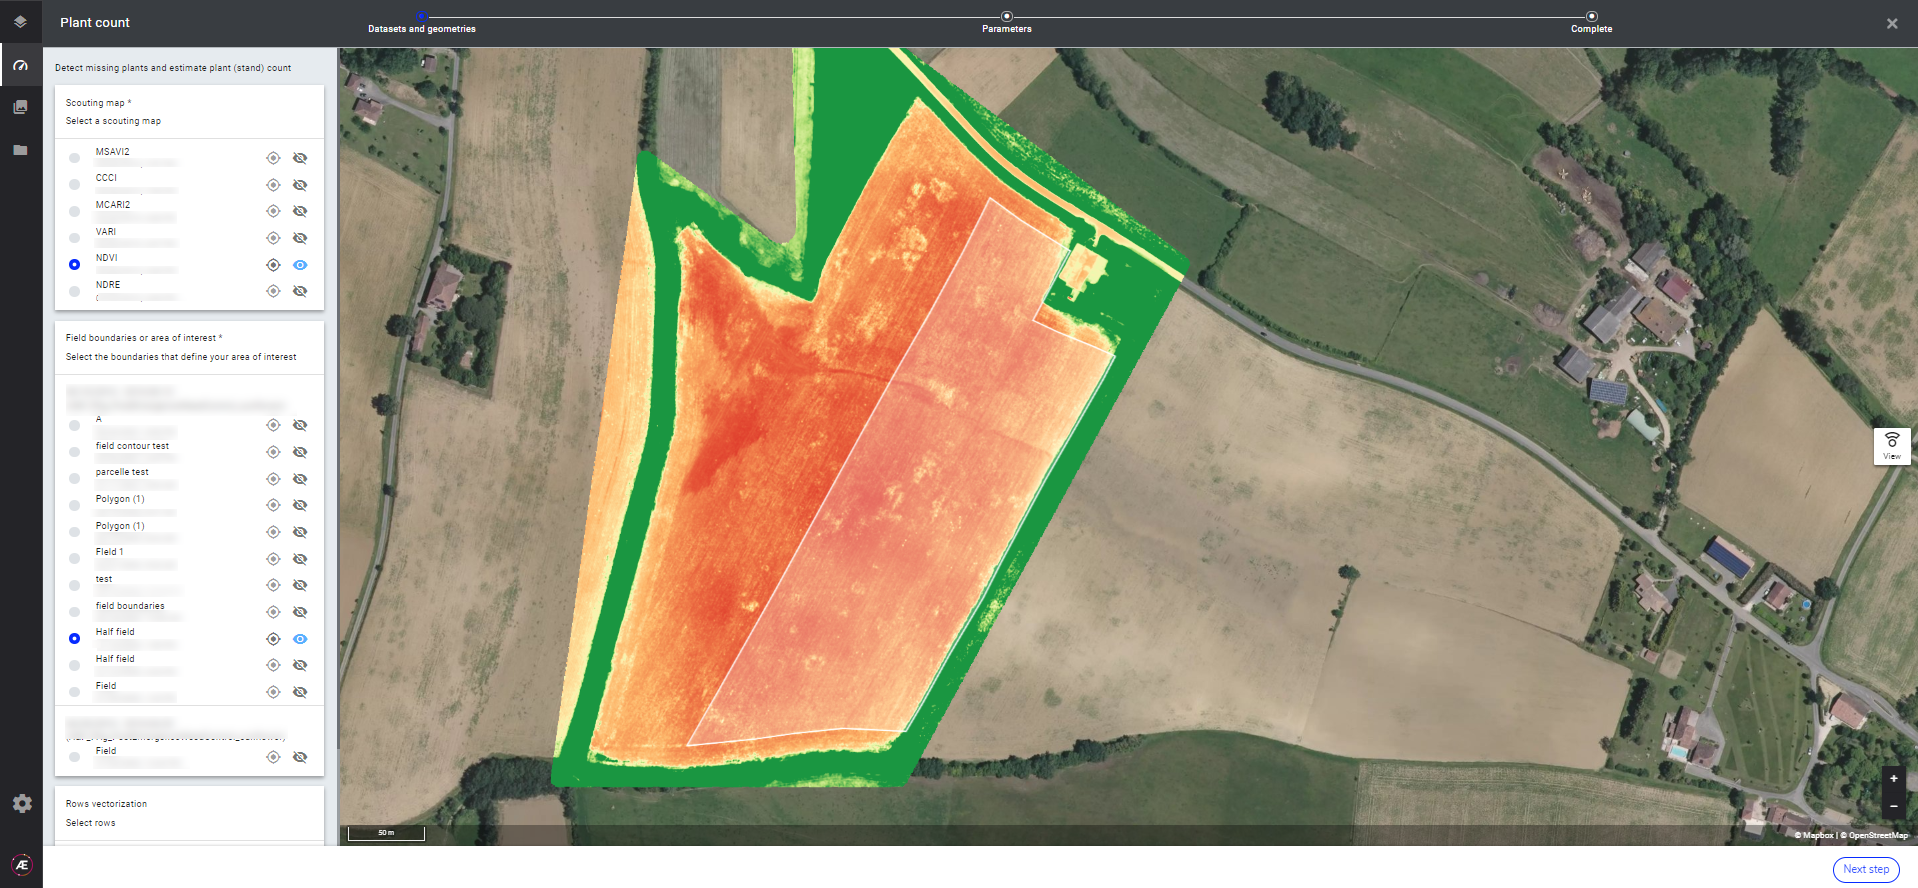
- Cartes de reconnaissance (NDVI par défaut) * ( Cartes de reconnaissance )
- Limites de champ * ( Comment créer des limites de champ )
- Vectorisation des lignes (si non disponible en entrée, elle sera calculée automatiquement)
- Espacement inter plantes théorique *
- Écartement des rangs *
- Suffixe des livrables
*Obligatoire
Capteur requis :
- Multispectral
- RVB
2. Livrables
- Lacunes + suffixe.geojson
- Lignes avec nombre de plantes + suffixe.geojson
- Nombre de plantes + suffixe.geojson
- Lacunes + suffixe.csv
- Lignes avec nombre de plantes + suffixe.csv
- Essai de comptage de plantes + suffixe.csv
3. Attributs
Le geojson et le fichier csv correspondant ont les mêmes attributs.
Sortie "Gaps" - uniquement pour les plantes en rangées avec les attributs suivants :
- row_index : identifiant de la ligne
- gap_id : identifiant de l'écart
- gap_length : Longueur de l'écart en mètre
Sortie « Plant count » avec les attributs suivants par champ :
- gap_length : longueur des écarts cumulés dans le champ en mètre
- plant_length : longueur de plante cumulée dans le champ en mètre
- plant_count : nombre de plantes dans le champ
- row_count : nombre de lignes dans le champ
Sortie « Rows with plant count » avec les attributs suivants par rangée :
- row_length : longueur de ligne en mètre
- plant_length : longueur de plante cumulée dans le rang en mètre
- plant_count : nombre de plantes dans la rangée en mètre
- gap_length : longueur des écarts cumulés dans la rangée en mètre
- veg_ratio : plant_length/row_length, entre 0 et 1
4. Flux de travail
Étape 1 :
- Sélectionnez l'indice de végétation qui sera utilisé pour traiter le comptage Plant and Gap (par défaut : NDVI est sélectionné)
Remarque : pour les jeux de données RVB, sélectionnez VARI (l'indice VARI doit être généré au préalable) - Sélectionnez les limites du champ*
- Sélectionner les lignes (facultatif / si déjà vectorisé)
*Les limites de champ doivent être un fichier vectoriel. Vous pouvez obtenir ce vecteur en dessinant une annotation qui représente les limites du champ et la convertir en vecteur.

Étape 2 :
- Remplir l'espacement inter plants (distance entre 2 plants d'un même rang)
- Remplir l'interligne (distance entre 2 lignes)
- Cliquez sur Lancer
5. Comment l'utiliser
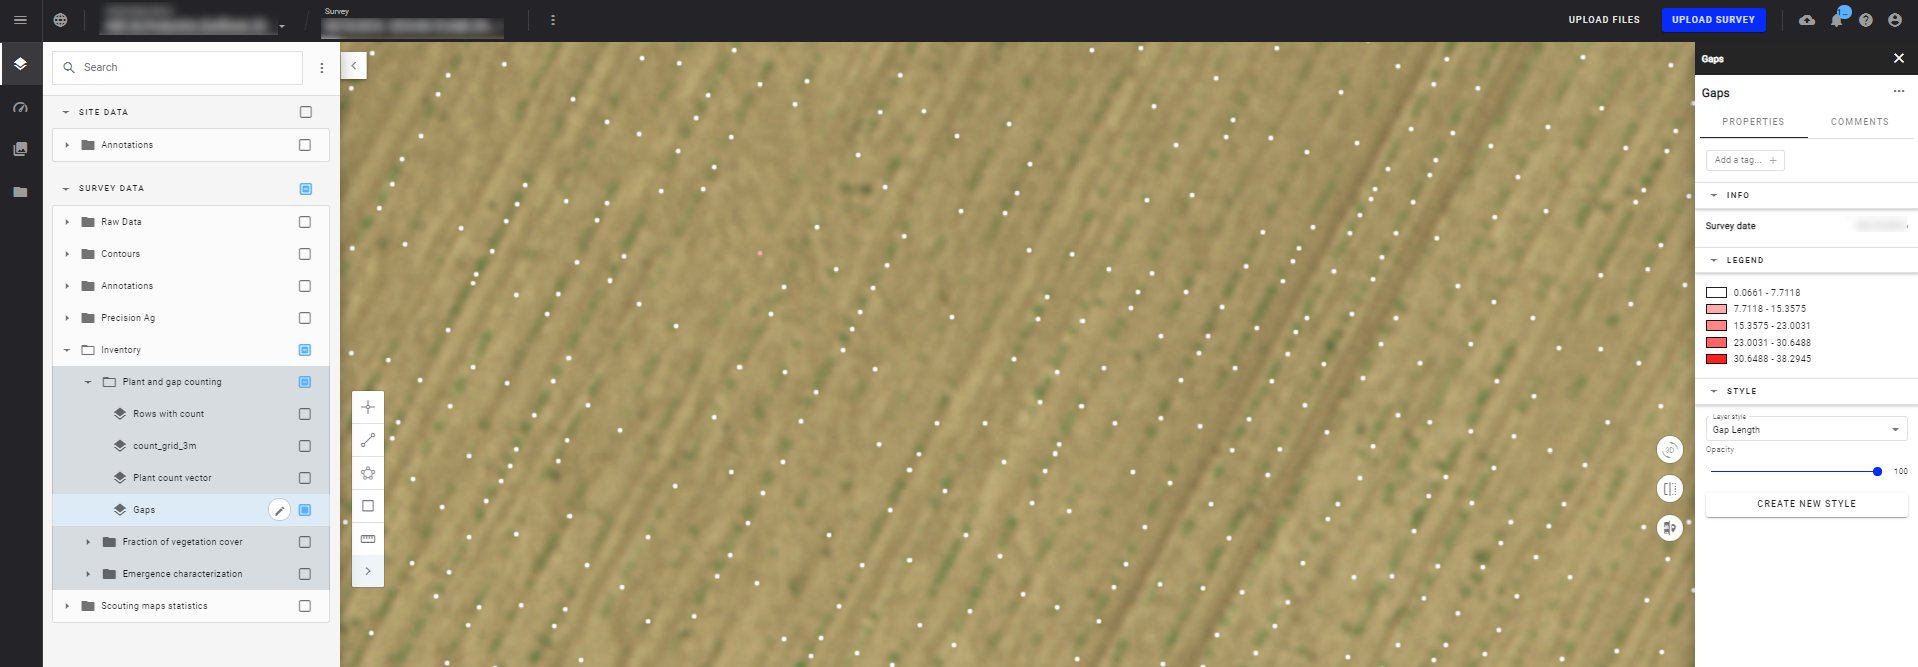
Dans le panneau des couches, sélectionnez la couche d'inventaire dans la section DONNÉES D'ENQUÊTE et sélectionnez entre les couches de nombre de plantes ou d'écarts à afficher :
- Si vous affichez la couche Gap, il est préférable d'afficher également la carte RVB pour localiser où se trouvent les lacunes. Les espaces sont représentés par de petits points et en fonction de la longueur de l'espace, une couleur spécifique est affichée et associée à la légende sur le panneau de droite. La longueur de l'écart peut également être affichée si vous cliquez sur le point.

- Si vous affichez la couche Plant count, le champ vectorisé apparaîtra. Vous pouvez cliquer sur le champ sur la carte pour afficher son numéro de plante.

En savoir plus : Style des calques vectoriels


