Tree Detection and Analysis
This all-in-one workflow will enable you to detect trees, measure tree height and provide advanced health and density indicators.
1. Inputs and parameters
- A DSM extracted from the photogrammetry process
- Reflectance Map (R,G,B, RE, NIR required) extracted from the photogrammetry process
- Field boundaries defining the area of interest (Field Boundaries Creation)
- Minimum Tree Height: minimum accepted plant height
- Minimum Canopy Radius: minimum accepted canopy radius
- Maximum Canopy Radius: maximum accepted canopy radius
- Grid tile size
- Optimal Tree Density: Ideal number of trees per hectare (used for density indicators)
2. Deliverables
- Tree crowns vector
- Tree tops density vector
- AOI Density vector
- AOI Grid density vector
Tree crowns vegetation index statistics:
- Tree crowns statistics NDVI
- Tree crowns statistics NDRE
- Tree crowns statistics CCCI
- Tree crowns statistics MSAVI2
3. Attributes
These are the attributes for the csv and geojson deliverables.
Tree crowns:
- tree_id: Unique tree id
- treetop_height: Tree height in m
- tree_area: crown surface in m2
Tree Tops density:
- tree_id: unique tree id
- min_tree_top_distance: distance from the nearest tree (tree top to tree top)
- min_tree_top_distance_unit: unit
- mean_tree_top_distance: average distance form the nearest trees (tree top to tree top)
- mean_tree_top_distance_unit: unit
- min_tree_crown_distance: distance from de nearest crown (crown to crown)
- min_tree_crown_distance_unit: unit
- mean_tree_crown_distance: average distance from the nearest crowns
- mean_tree_crown_distance_unit: unit
- nb_touching_crowns: number of crowns that touch the tree (can not be higher than 5)
AOI Density and Grid density:
- number_of_trees: number of trees in the area of interest (AOI)
- tree_density: number of trees per ha in the AOI
- tree_density_unit: unit
- tree_density_deviation: 100*(tree_density - ideal_tree_density)/ideal_tree_density.
- tree_density_deviation_unit: unit
- tree_area: surface covered by the crowns in the AOI
- tree_area_unit: unit
- mean_tree_top_distance: average distance between the trees in the AOI (average distance of the five nearest trees for each tree)
- mean_tree_top_distance_unit: unit
- mean_min_tree_top_distance: lowest average distance between the trees in the AOI (ie average distance between the nearest tree for each trees)
- mean_min_tree_top_distance_unit: unit
- mean_tree_crown_distance: average distance between the crowns in the AOI (ie average distance of the five nearest tree crowns for each trees)
- mean_tree_crown_distance_unit: unit
- mean_min_tree_crown_distance: lowest average distance between each crown in the AOI (ie average distance of the nearest crown for each tree)
- mean_min_tree_crown_distance_unit: unit
- mean_nb_touching_crowns: average number of crowns that touch a crown in the AOI
4. Workflow
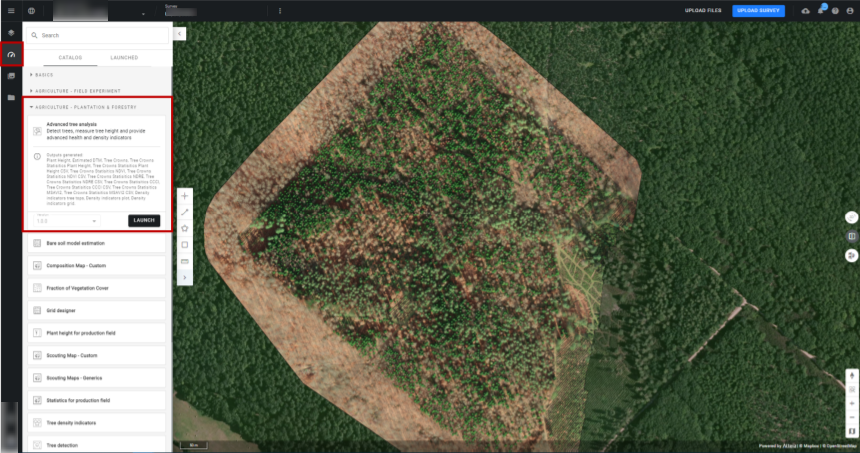
Step 1: Once in your project, you need to launch the analytic “Tree detection and analysis” from the Analytic Catalog.
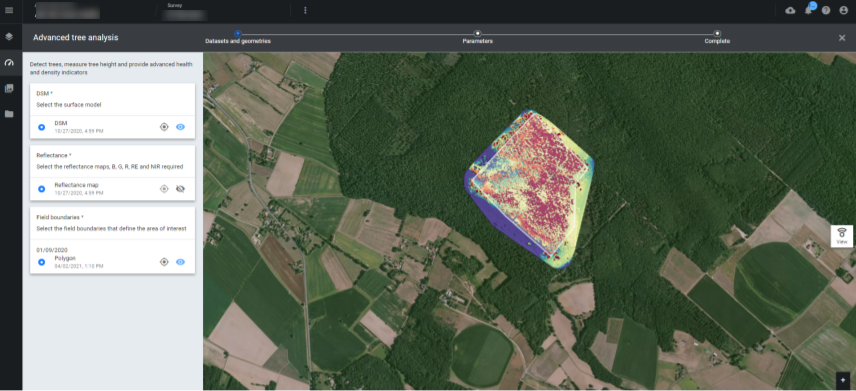
Step 2: Select your file inputs, DSM, Reflectance map, and Field boundaries. You can click on the small eye icon to visualize the layers.
Step 3: Define your parameters and click on “Launch Tree detection and analysis”.
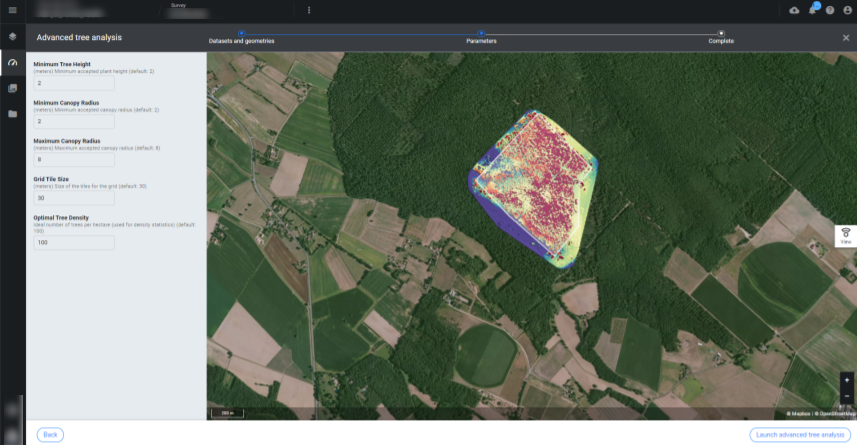
- Minimum Tree Height: 2 meters by default
- Minimum Canopy Radius: 2 meters by default
- Maximum Canopy Radius: 8 meters by default
- Grid tile size: 30 meters by default
- Optimal Tree Density: 100 trees per hectare by default
5. The results
You can visualize the results by selecting the “Inventory” layer from the SURVEY DATA section on the left side menu.
- When displaying the Tree crowns, you can choose to display the results based on specific attributes, by opening the Information Panel.
- You can choose between:
- Neutral
- Tree crown surface
- Tree height
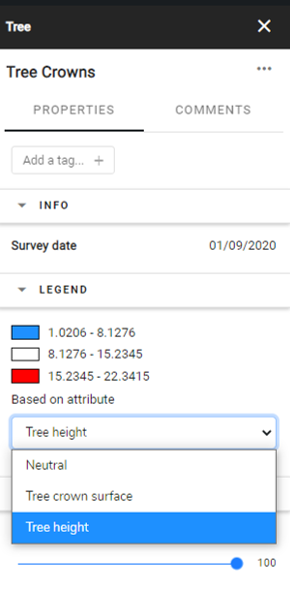
The map will show a color based classification and the legend, will be visible on the Information Panel.
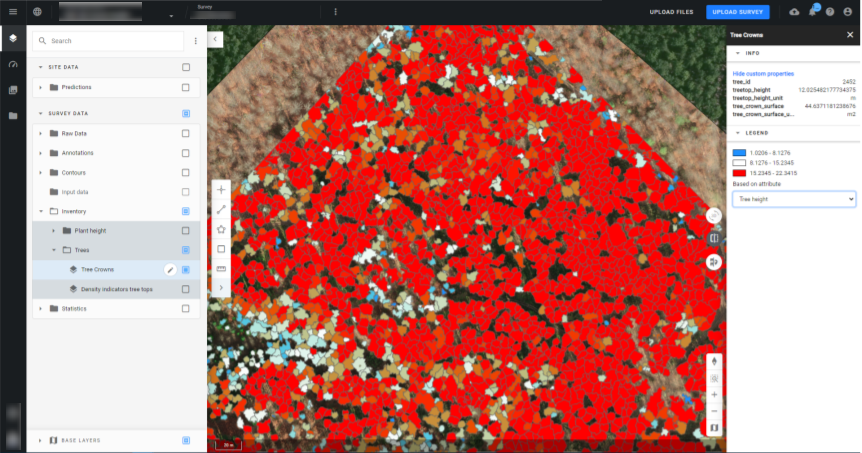 By clicking on a detected tree, the attributes of that tree will appear also in the information panel.
- When displaying the Tree tops density you can choose to display the results based on specific attributes, by opening the Information Panel.
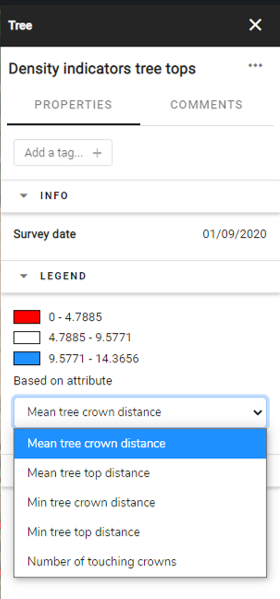
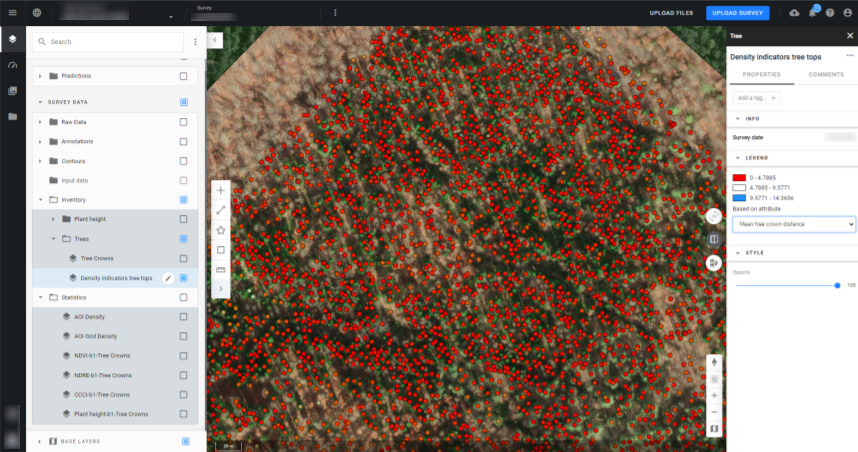
You are able to see the density at the tree level:
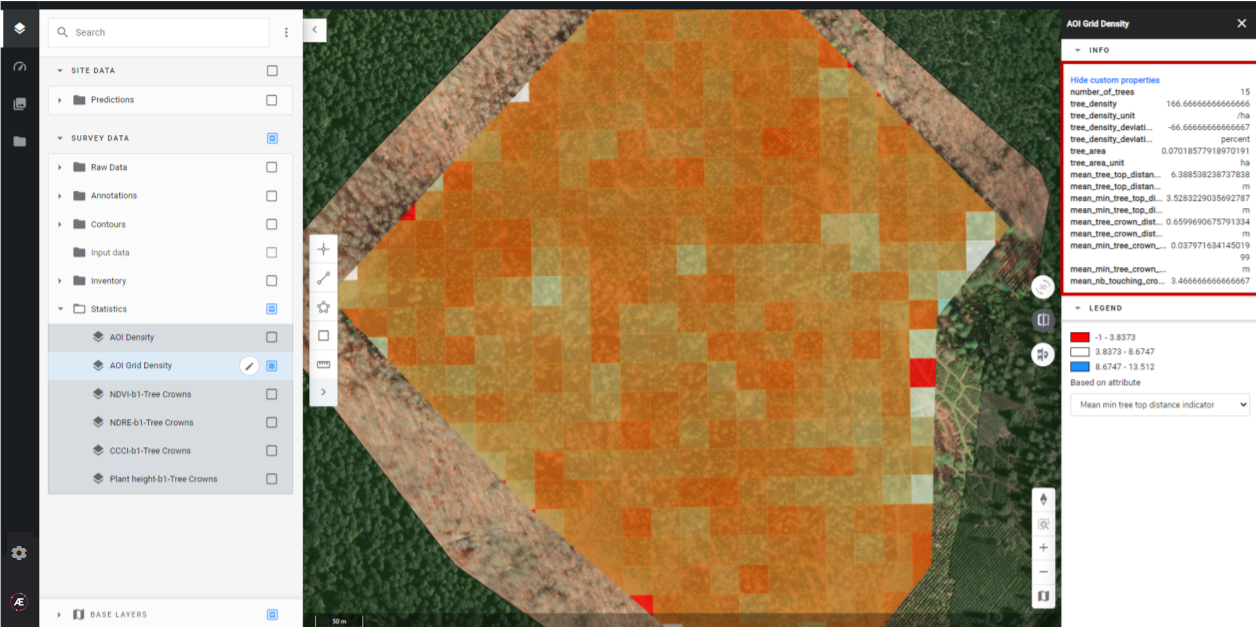
- When visualizing the AOI Grid density you will be able to visualize the tree density by zones. You can also choose the attribute you want to take into account for the grid visualization.
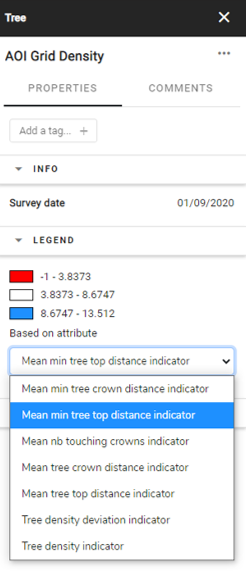
In this case the grid shows the results based on the attribute “ Mean min tree top distance indicator”:
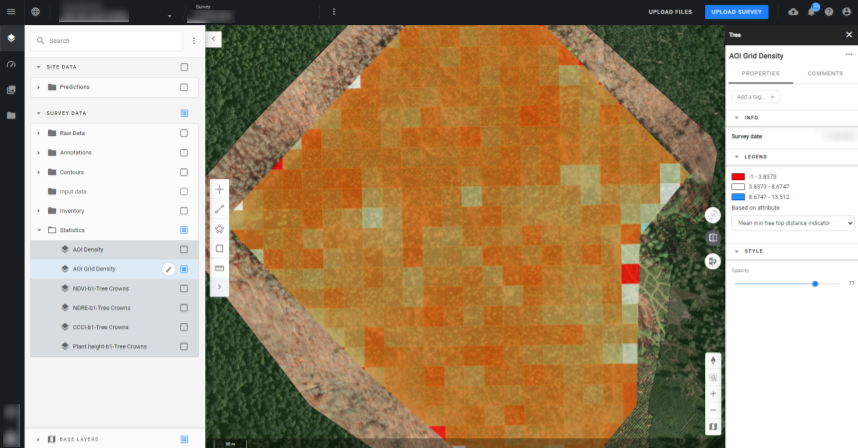
When clicking on a determined area on the grid, you will be able to see the attributes of the zone on the Info Panel:
