Tree Density Indicator
This analytics allows the generation of advanced density statistics in a plantation or forest.
1. Inputs and parameters
- Treetops (Tree detection)
- Tree crowns (Tree detection)
- Field boundaries
- Grid (optional)
- Suffix: to be added to the result name
- Ideal tree density: ideal number of trees per hectare
2. Deliverables
- AOI Density vector: provides density indicator in the Area of Interest
- AOI Grid density vector: provides density indicator in the Area of Interest with a grid
3. Attributes
AOI Density vector and AOI Grid density vector:
- number_of_trees: number of trees in the AOI
- tree_density: number of trees per ha in the AOI
- tree_density_unit: unit
- tree_density_deviation: 100* (tree_density - ideal_tree_density)/ ideal_tree_density (with ideal_tree_density = 100 trees/ha)
- tree_density_deviation_unit: unit
- tree_area: surface covered by the crowns in the AOI
- tree_are_unit: unit
- mean_tree_top_distance: average distance between the trees in the AOI (average distance of the five nearest trees for each tree)
- mean_tree_top_distance_unit: unit
- mean_min_tree_top_distance: lowest average distance between the trees in the AOI (ie average distance between the nearest tree for each trees)
- mean_min_tree_top_distance_unit: unit
- mean_tree_crown_distance: average distance between the crowns in the AOI (ie average distance of the five nearest tree crowns for each trees)
- mean_tree_crown_distance_unit: unit
- mean_min_tree_crown_distance: lowest average distance between each crown in the AOI (ie average distance of the nearest crown for each tree)
- mean_min_tree_crown_distance_unit: unit
- mean_nb_touching_crowns: average number of crowns that touch a crown in the AOI
4. Workflow
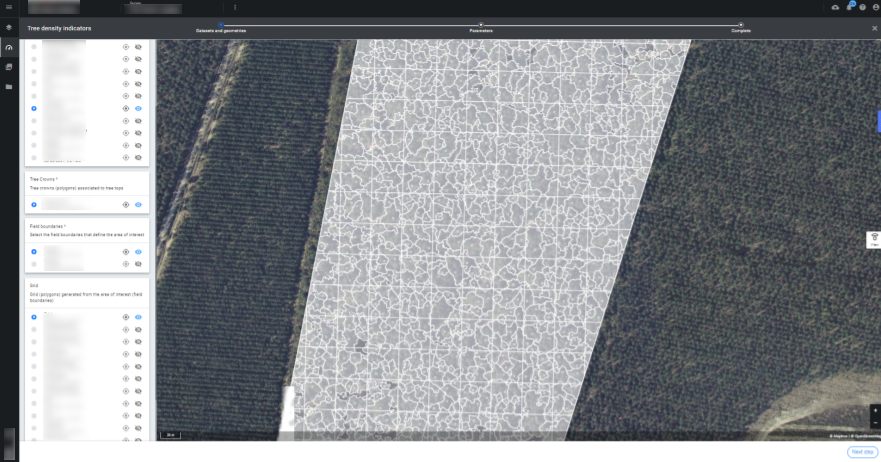
Step 1 - Select the analytic "Tree density indicator" from the Analytic Catalog.
Step 2 - Select your file inputs, Treetops, Tree crowns, Field Boundaries, and your Grid. You can click on the small eye icon to visualize the layers.
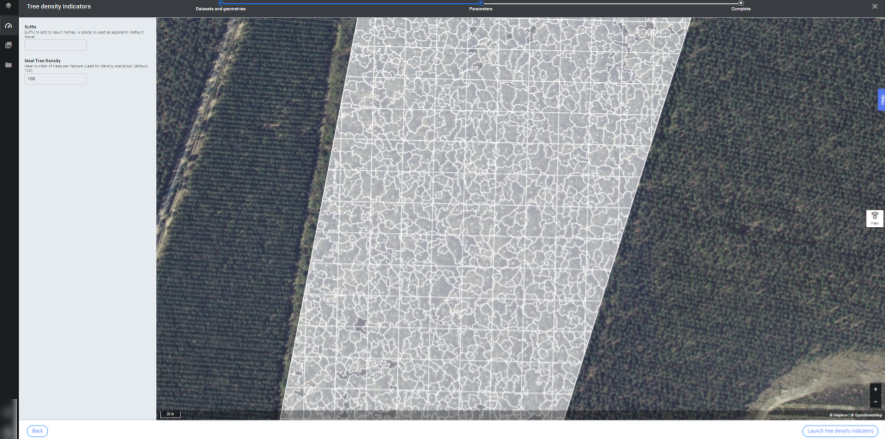
Step 3 - Define your parameters and click on "LAUNCH TREE DENSITY INDICATOR".Suffix: Default value= none
Ideal tree density: Default value= 100
5. Results
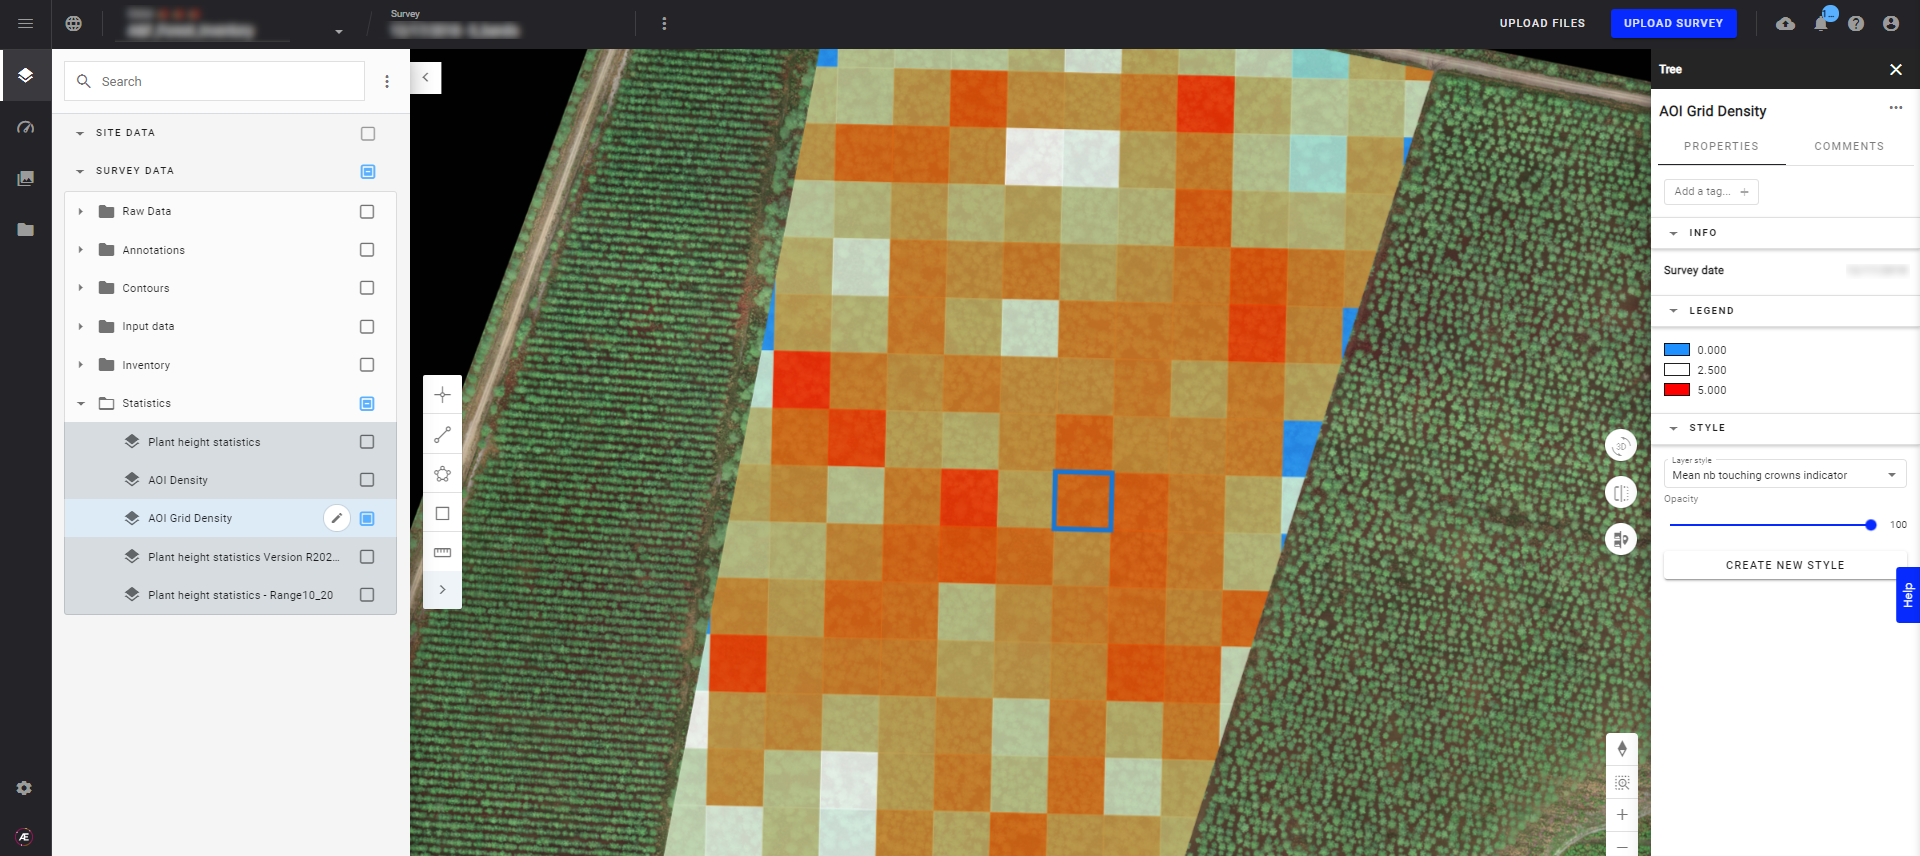
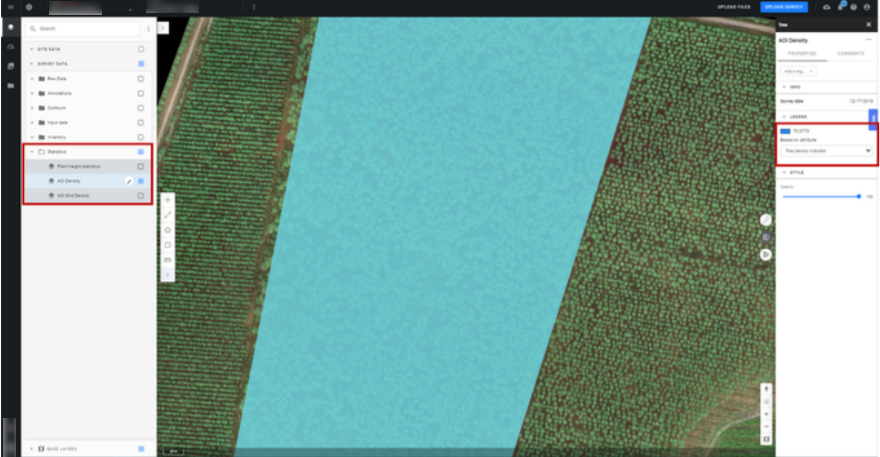
You can visualize the results by selecting the “Statistics” category from the SURVEY DATA section on the left side menu. Under this category, you will have all the density statistics layers.
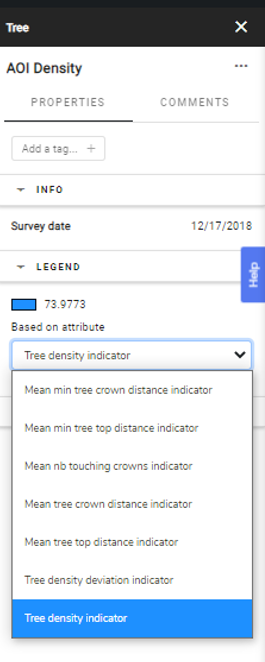
- When displaying the AOI Density you can choose in the Info Panel on the left, to visualize the density results based on different attributes:
- The same for the AOI Grid Density, when displaying the results you can choose to visualize them based on the corresponding attributes. A color-based grid will be then displayed and the legend is visible on the left side Info Panel.
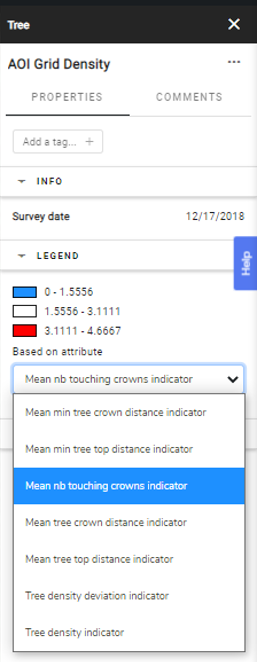
The grid helps you visualize the distribution of the density indicator in the plantation.
